Comprehensive Crypto Options and Derivatives Analytics
Options, futures/perps, and DeFi options data and analytics institutional traders rely on to drive investment decisions.
Best in Class Options & Derivatives Analytics
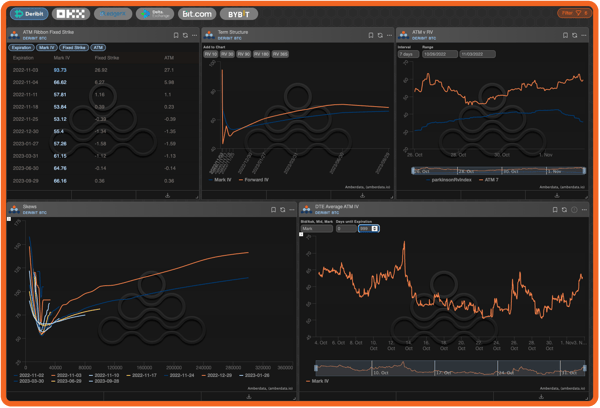
AD Derivatives offers institutional-grade analytics, tools, and data sets built on years of deep trading expertise and trusted by institutional traders. Access a vast repository of live and historical crypto options data and leverage years of historical volatility surfaces like strikes and moneyness. Access our comprehensive API and customizable analytics UI tools to visualize data and trends. Download certain datasets in S3 buckets with 100ms granularity.
Options Analytics Tools Built on Years of Expertise
AD Derivatives options analytics tools and data sets are built based on years of deep options trading expertise and trusted by institutional traders.
Access Best-in-Class Derivatives Analytics
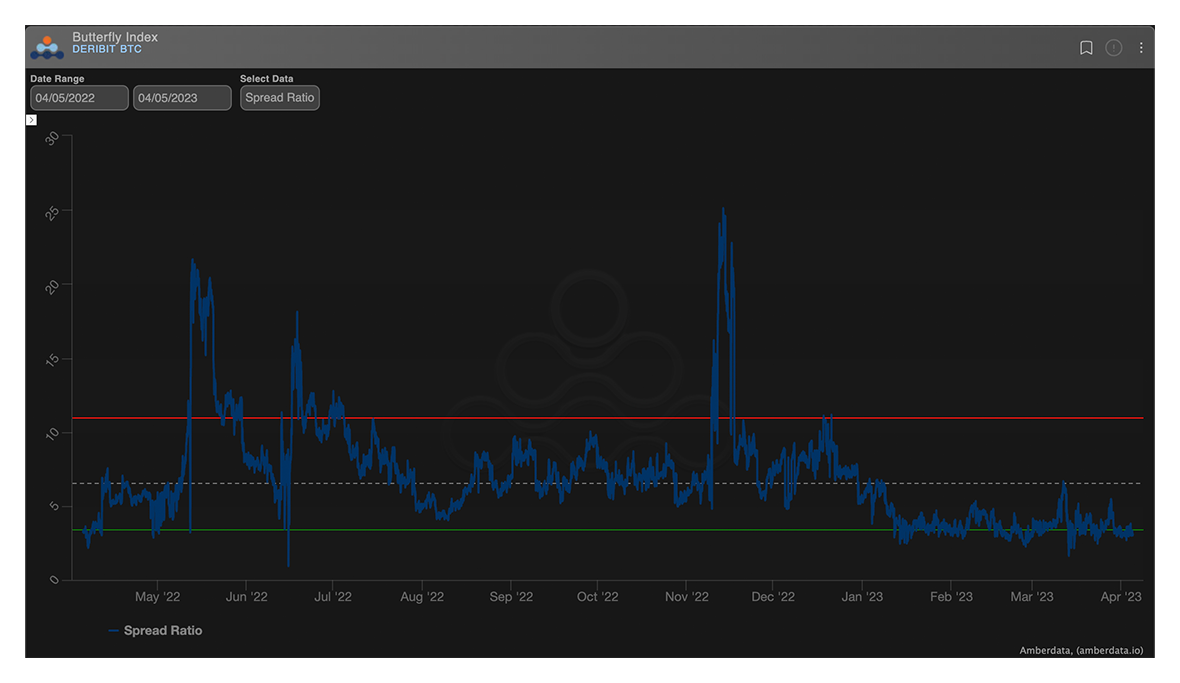
Butterfly Index
Price wings versus the belly with Deribit's DVOL index divided by at-the-money volatility.
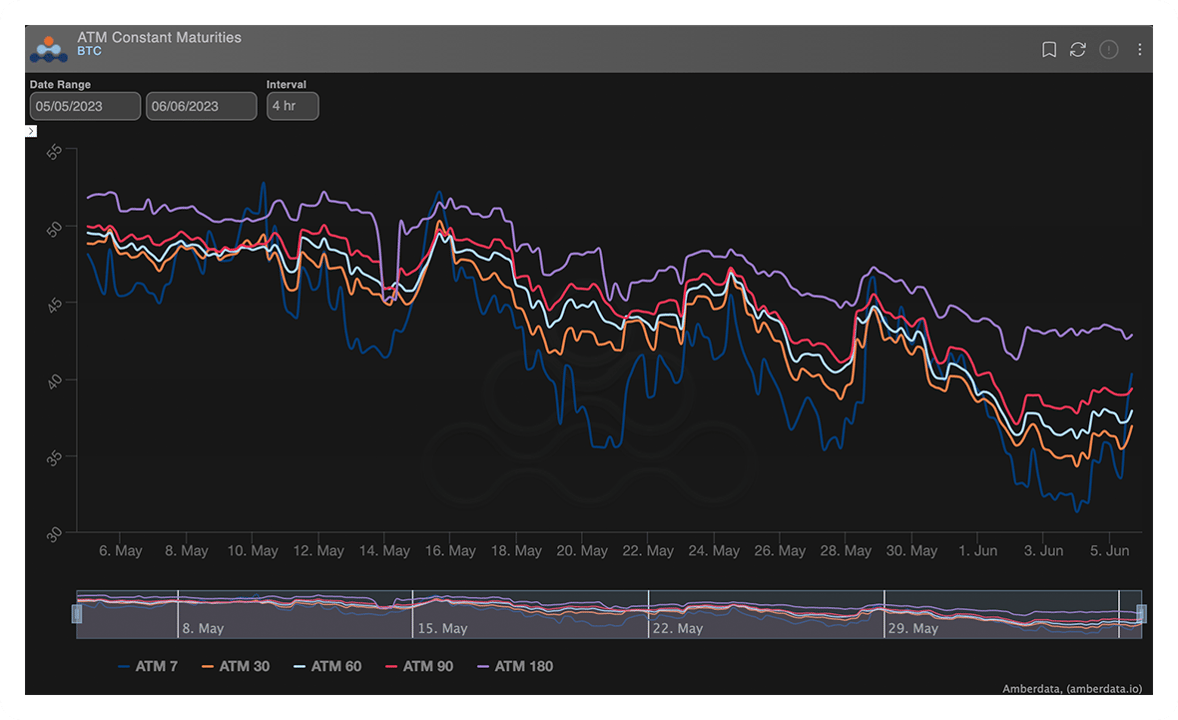
Constant Maturities
Get access to interpolated volatility data for consistently clean analysis.
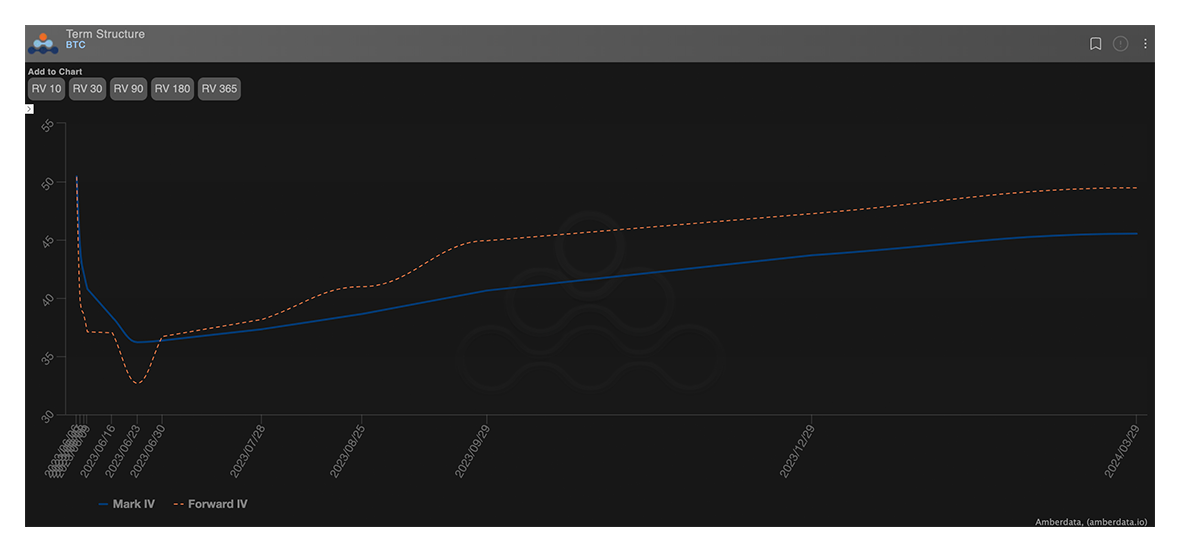
Term Structure
Leverage rich and cheap maturities using term structure charts with forward volatilities superimposed.
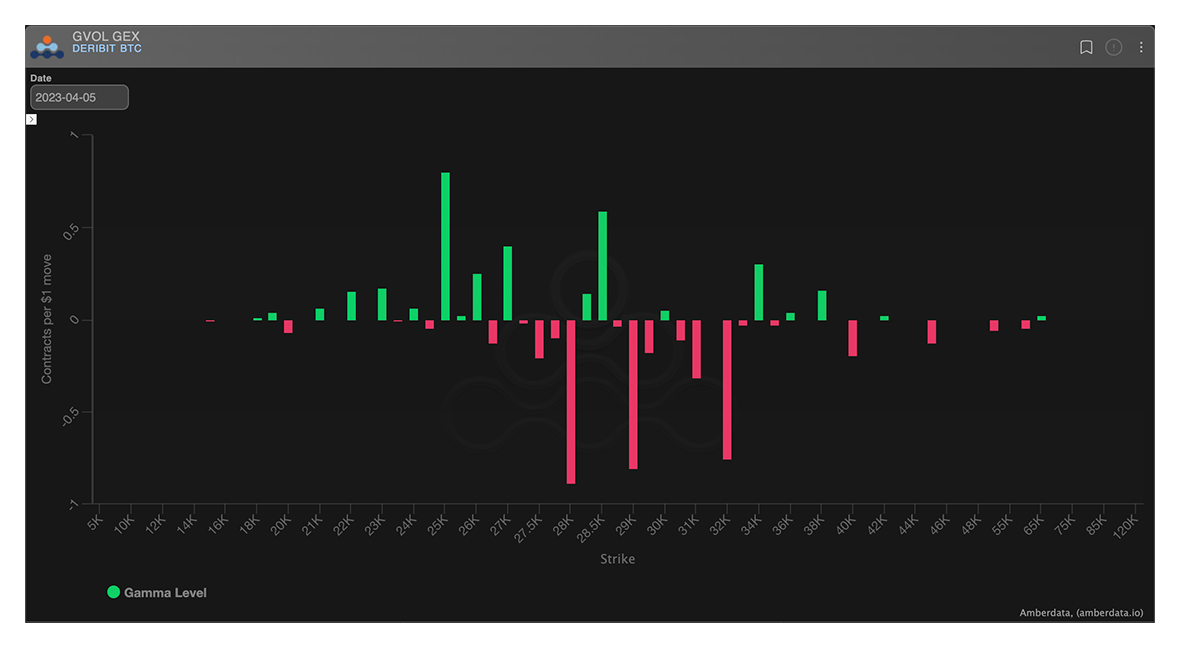
Gamma Exposure (GEX)
Estimate hedging flows with sophisticated dealer positioning.
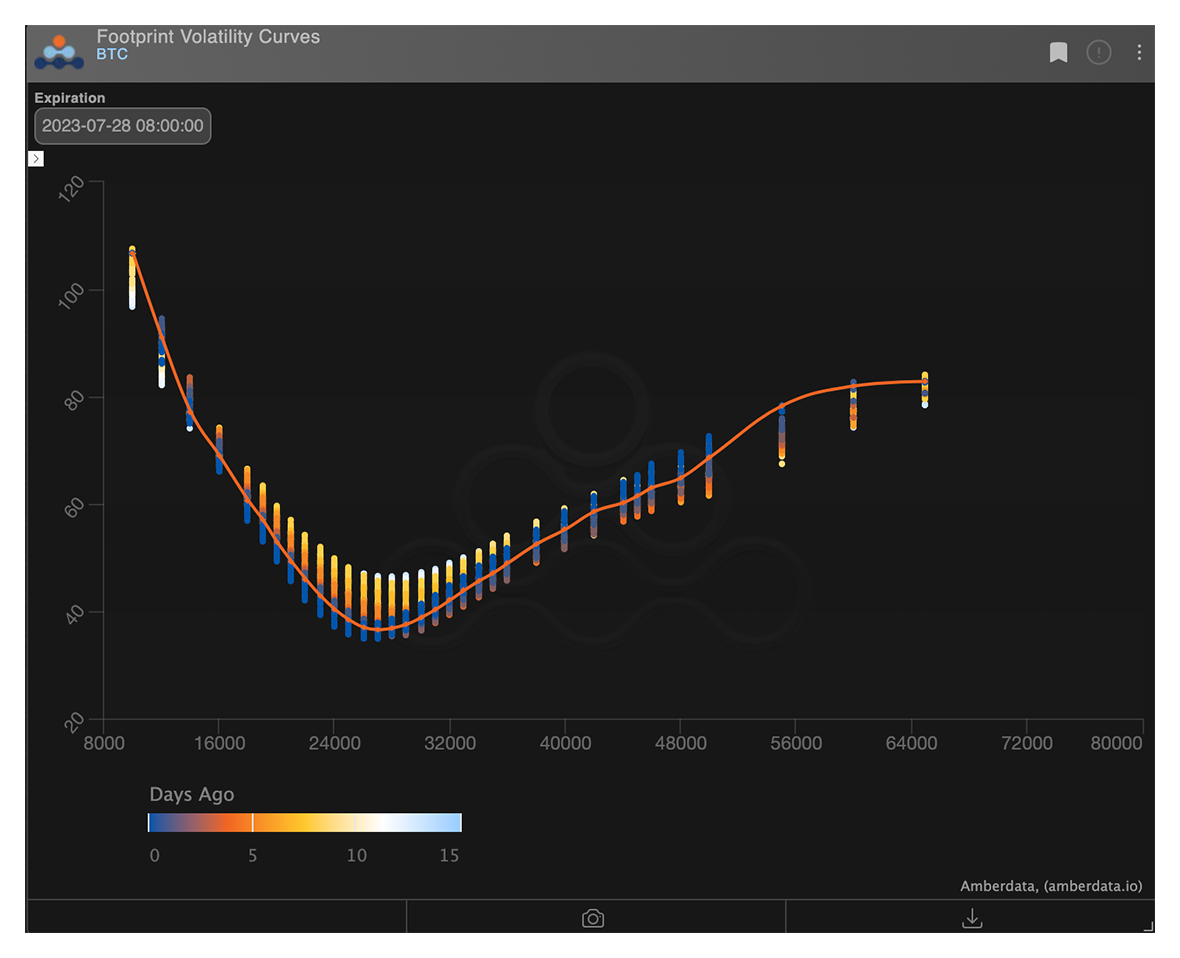
Footprint Volatility Curves
Contextualize the range of skews using volatility smiles combined with recently observed distributions.
Butterfly Index
Price wings versus the belly with Deribit's DVOL index divided by at-the-money volatility.

Constant Maturities
Get access to interpolated volatility data for consistently clean analysis.

Term Structure
Leverage rich and cheap maturities using term structure charts with forward volatilities superimposed.

Gamma Exposure (GEX)
Estimate hedging flows with sophisticated dealer positioning.

Footprint Volatility Curves
Contextualize the range of skews using volatility smiles combined with recently observed distributions.

-1.png?width=600&name=image%20(1)-1.png)
TradFi Crypto Options Data
Analyze crypto-focused stocks and ETFs alongside CeFi and DeFi markets on Amberdata Derivatives, the leading crypto options analytics platform. Now supporting TradFi crypto data, we fully integrate all three venues—TradFi, CeFi, and DeFi—into one seamless experience within our existing Amberdata Derivatives functionality. With the same familiar data format and clean and reliable volatility data, incorporate all crypto options markets into your strategies with ease and precision.
Customizable Realized Vol Dashboards
With over 90 alt coins and coverage across major pairs, analyzing movements in the underlying markets is fundamental to options pricing.
Launch the AppCustomizable Realized Vol Dashboards
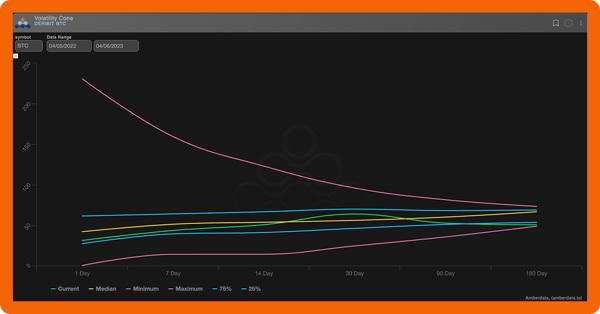
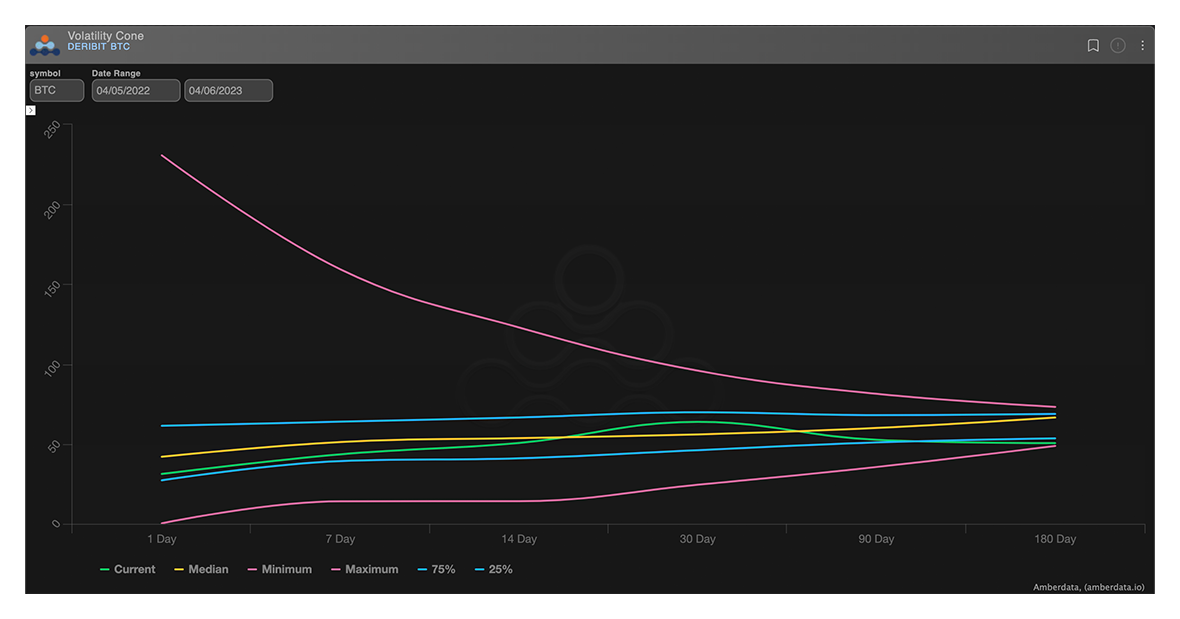
Volatility Cone
Contextualize the range of realized volatility for various measurement windows.
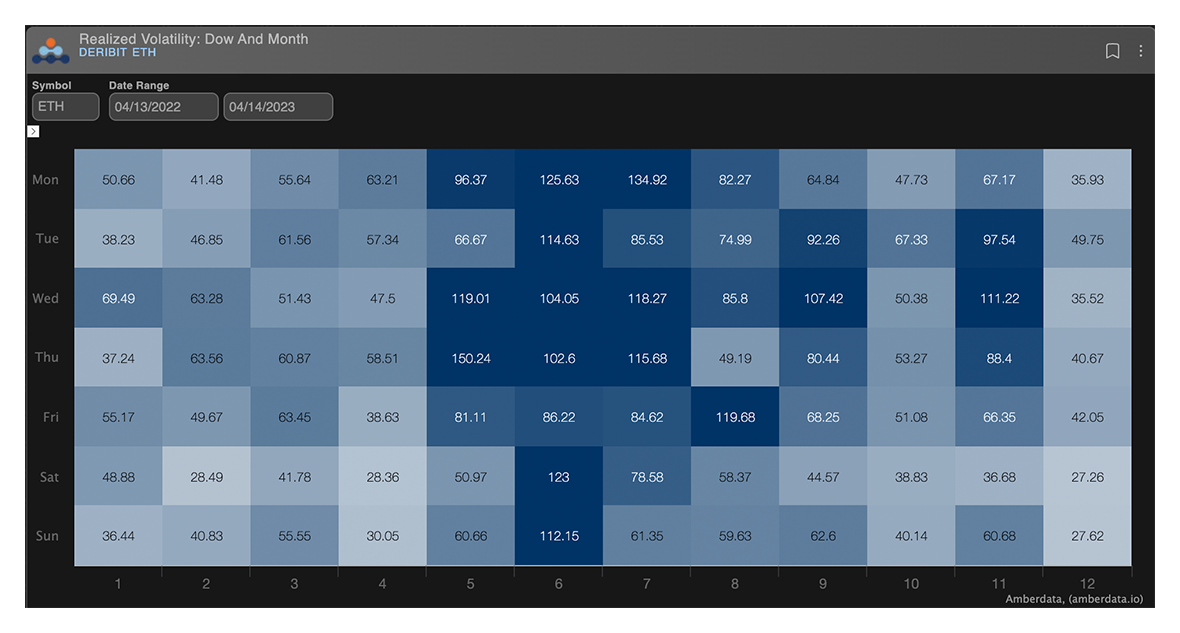
Dow and Month
Leverage the intersection of realized volatility for day of the week and month of the year.
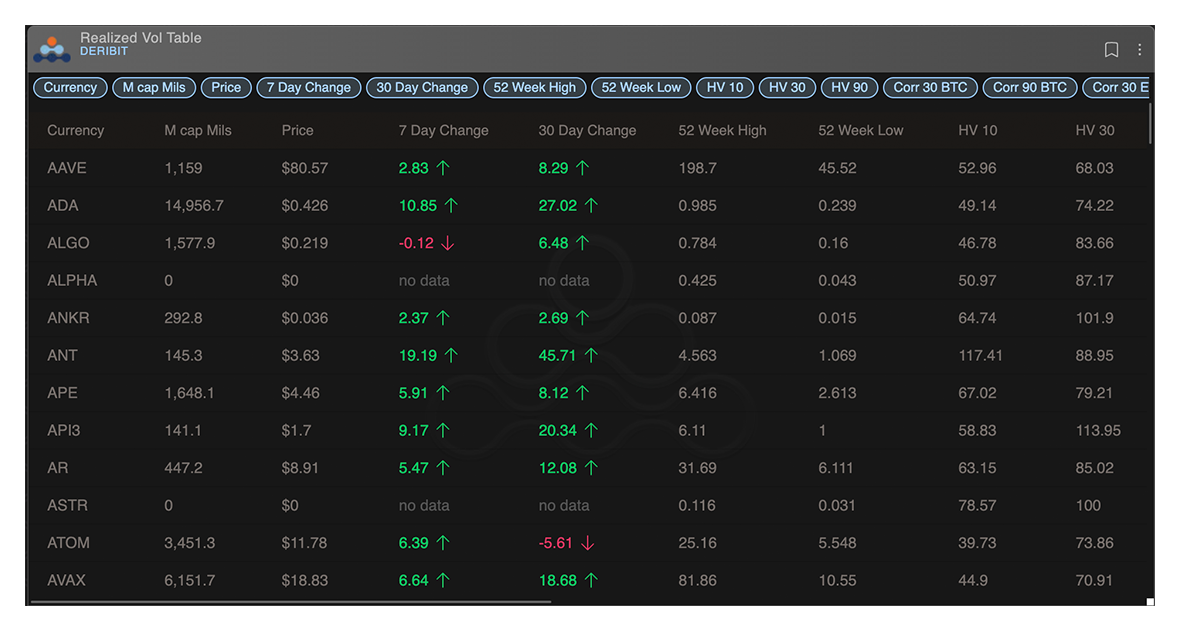
Realized Vol Table
View altcoin realized volatilities with major pair correlations.
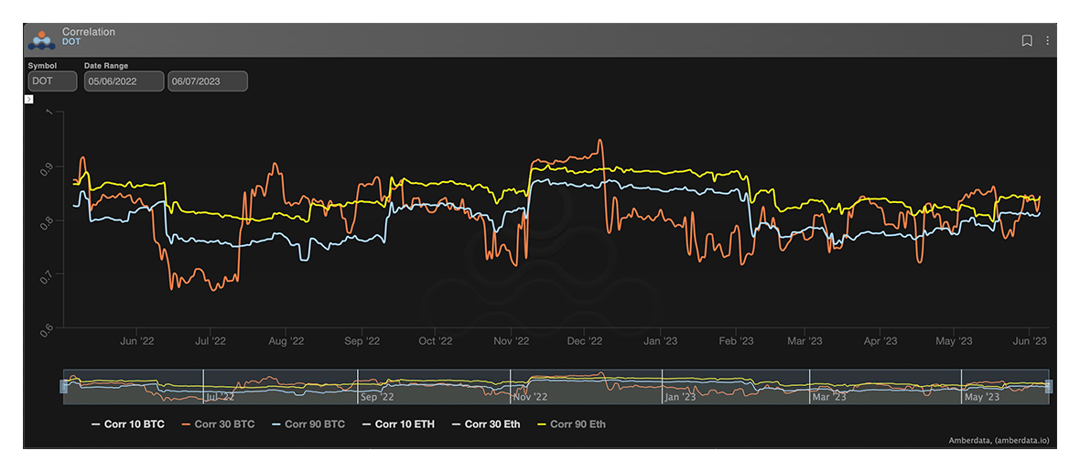
Correlation
Compare Bitcoin and ETH correlations to altcoins.
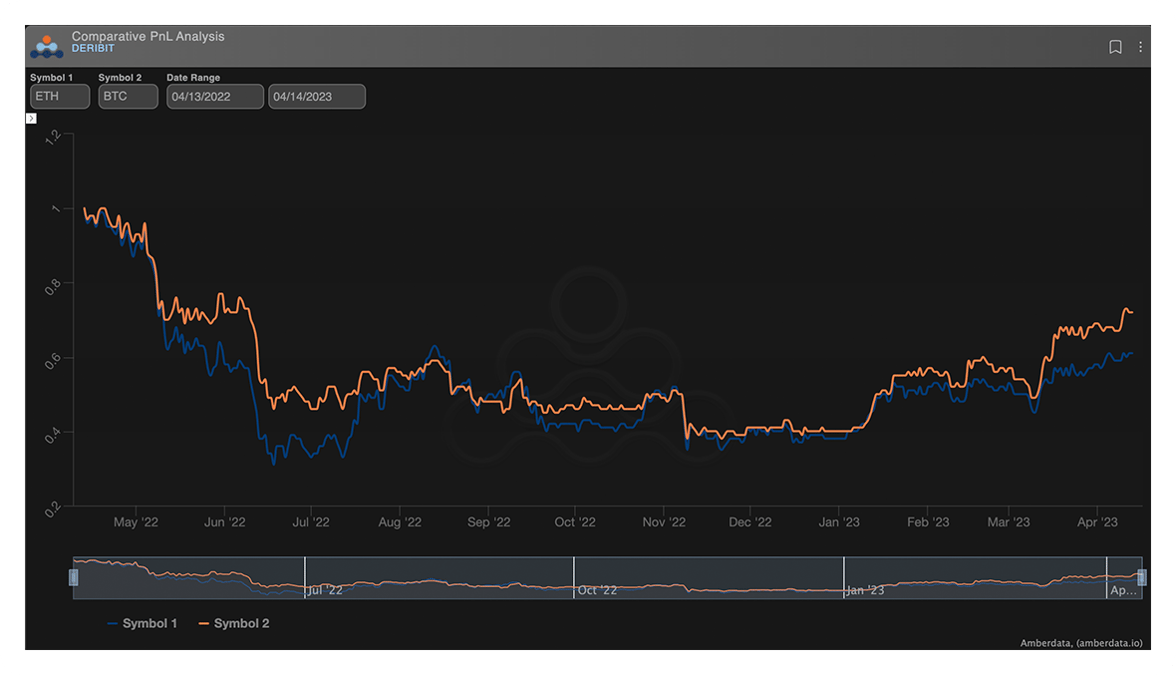
Comparative PnL Analysis
See performance metrics from various start dates.
Volatility Cone
Contextualize the range of realized volatility for various measurement windows.

Dow and Month
Leverage the intersection of realized volatility for day of the week and month of the year.

Realized Vol Table
View altcoin realized volatilities with major pair correlations.

Correlation
Compare Bitcoin and ETH correlations to altcoins.

Comparative PnL Analysis
See performance metrics from various start dates.

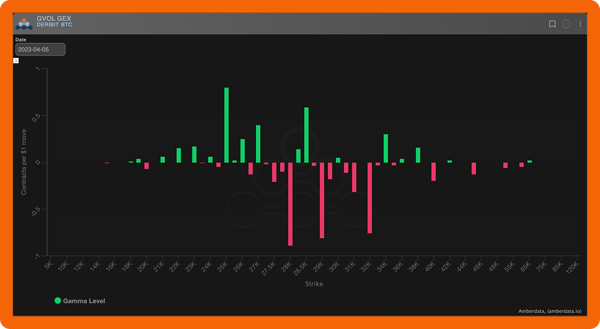
Back out dealer positioning with Amberdata's proprietary model
With metrics like Gamma Exposure, measure true trade “aggressors” combined with immediate changes in open interest. Leverage a set of over 30 proprietary trade heuristics. Anticipate hedging flows and other market-moving activity.
Learn MoreKey Benefits of Derivative Metrics
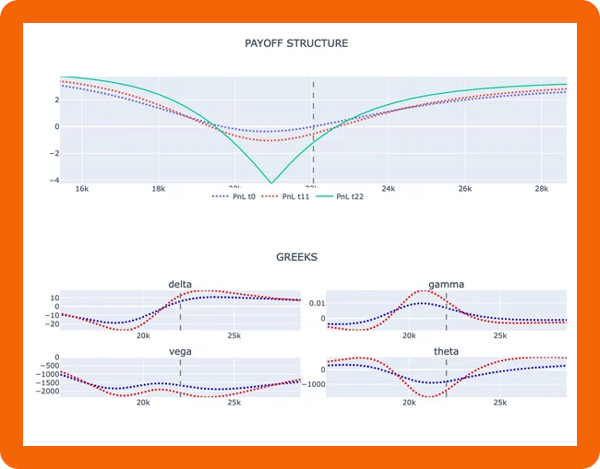
Monitor and Manage Your Risk
AD Derivatives offers a full suite of risk monitoring tools. Use visuals such as options payoff charts to tailor your portfolio risk. Estimate payoffs from changes in the underlying prices, implied volatility shocks, and added delta-one hedges.
Risk Monitoring Use Cases
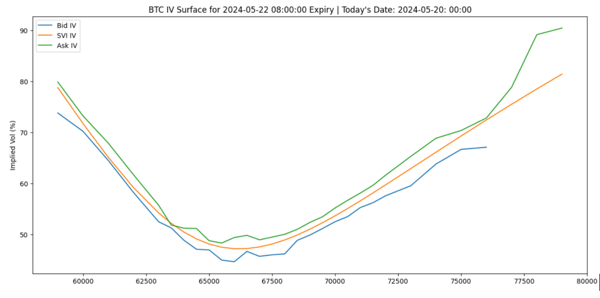
Volatility Surface Calibrations
SVI TrueLine
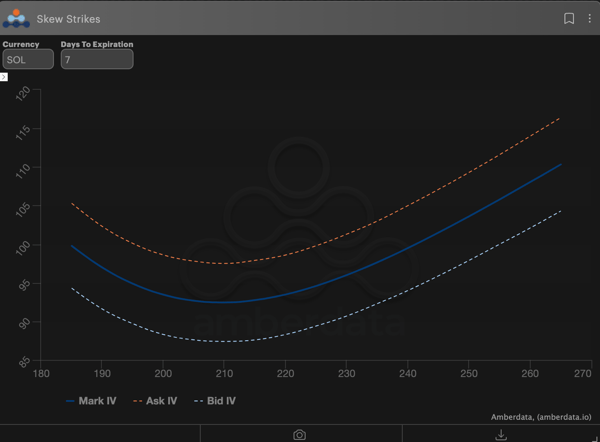
Cryptocurrency markets are characterized by high volatility, newly distinctive trading behaviors, and low liquidity, all of which pose significant challenges for traditional volatility modeling techniques.
Amberdata’s robust calibration methodology employs the flexibility and efficiency of the Stochastic Volatility-Inspired (SVI) model while addressing the unique volatility surfaces observed in crypto markets. With significant improvements over traditional methods for volatility surface estimations, advanced optimization techniques, and liquidity-adjusted pricing mechanisms, our proprietary SVI TrueLine calibration is the most accurate and stable model in the market.
Alt-Coin Vol Surfaces
Amberdata’s methodology solves the problems of traditional approaches and redefines what’s possible for alt-coin analytics.
Greater Stability: By relying on equity market data, the Equity Basket Bootstrap avoids the noise and fluctuations that plague realized moments in crypto markets.
Unmatched Robustness: Cointegration ensures the methodology is rooted in mathematically sound relationships, while GARCH scaling adds precision to volatility estimates.
Industry Differentiation: This unique approach is difficult to replicate, providing Amberdata customers with a truly differentiated and reliable view of Alt-coin volatility surfaces.
Key Features
Use Cases
Market Makers
Streamline arbitrage-free volatility surface calculations and manage unique risks in real-time with 5-minute granularity for more precise pricing and risk management.
DeFi Protocols
Integrate robust volatility modeling to optimize liquidity pools and ensure stable pricing mechanisms using advanced, liquidity-adjusted SVI calibration techniques.
Exchanges
Enhance pricing accuracy and mitigate risk by incorporating SVI TrueLine's dynamic volatility surface calibration to support the volatility profiles of BTC and ETH options.
OTC Desks
Leverage historical backfills and fine-tuned volatility surfaces to efficiently price and hedge large, bespoke transactions in the volatile crypto market.
DeFi Options Vaults & DEXs
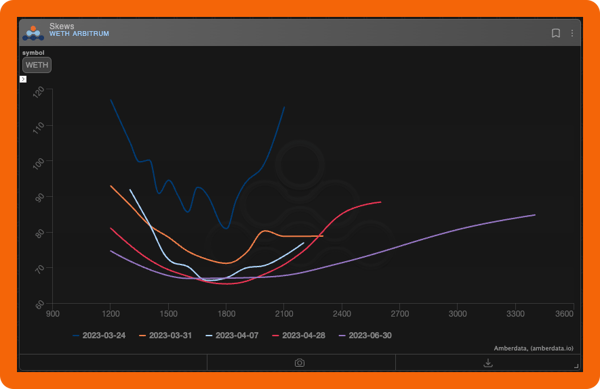
With the Amberdata Derivatives analytics platform and API, access multi-chain liquidity and volume data to find edge and alpha in the nascent DeFi Option Markets.
✅ Explore complex DeFi Options analytics including skews, net vega, delta exposure, and open interest.
✅ Compare CeFi Versus DeFi Trade Data.
✅ Identify top traders and monitor their strategies.
✅ Explore live and historical DeFi data as far back as the protocol itself.
Explore DeFi Derivatives